
In this blog post, I will describe how skale.dev developed dashboards for a multiroom facility that ingests data from a variety of sensors, stores it securely on a hosted influxdb, and visualizes it with grafana dashboards. I will also explain how we incorporated custom datapoints and how we optimized heat consumption for the facility.
Multiroom Facility
The facility consists of several rooms, each with different functions and requirements. Some rooms are used for experiments, some for storage, some for meetings, etc. Each room has sensors that measure temperature, humidity, air quality, light intensity, and other parameters. The sensors send data to a central server via MQTT protocol.

Sensor Database
The server runs influxdb, a time-series database that is optimized for storing and querying high-volume data. We chose influxdb because it offers high performance, scalability, reliability, and security. We also use influxdb cloud, a hosted service that provides backup, monitoring, and support. The influxdb cloud allows us to access our data from anywhere and reduces the maintenance cost.
Data Visualization
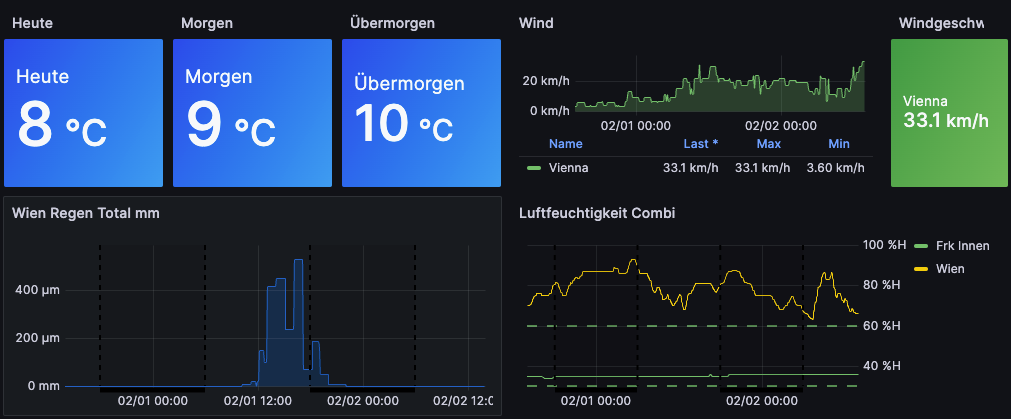
The server also runs grafana, an open-source platform for data visualization and analysis. Grafana connects to influxdb and displays the data in interactive dashboards. Grafana offers many features such as alerts, annotations, variables, panels, plugins, etc. We use grafana to create custom dashboards for each room and for the whole facility. The dashboards show the current and historical values of the sensor data, as well as trends and patterns.

Datapoints
One of the challenges we faced was how to incorporate custom datapoints into our dashboards. For example, we wanted to show the occupancy rate of each room, the energy consumption of each device, the carbon footprint of the facility, etc. These datapoints are not directly measured by the sensors, but derived from other data sources or calculations. To solve this problem, we used grafana’s transform feature, which allows us to manipulate and combine data from different queries. We also used grafana’s expressions feature, which allows us to apply mathematical functions and logic to the data.
Another challenge we faced was how to optimize heat consumption for the facility. The facility has a central heating system that controls the temperature of each room. However, the system is not very efficient and consumes a lot of energy. To improve this situation, we used grafana’s alert feature, which allows us to set thresholds and conditions for the sensor data and trigger actions when they are met. We also used grafana’s notification feature, which allows us to send messages to different channels such as email, slack, telegram, etc. We configured grafana to alert us when the temperature of a room is too high or too low and to notify us with suggestions on how to adjust the heating system accordingly.
By using skale.dev’s solution, we were able to create dashboards for a multiroom facility that ingest data from a variety of sensors, store it securely on a hosted influxdb, and visualize it with grafana dashboards. We were also able to incorporate custom datapoints and optimize heat consumption for the facility. This resulted in improved performance, efficiency, sustainability, and user experience for the facility.
Schreibe einen Kommentar
Du musst angemeldet sein, um einen Kommentar abzugeben.